Understanding subgroup-level performance can often involve several comparisons- performance relative to other subgroups in a school, performance relative to other students in the state, and performance on an absolute scale. The visuals below attempt to combine those comparisons into a single visual.
The first visual shows the distribution of mathematics performance by subgroup for all middle schools in Georgia. Each school is represented by a gray dot, and David T Howard, the selected school, is represented by a red dot. The x-axis shows the CCRPI math indicator score, grouped into five-point bins.
The graph shows that Howard’s “All Students” performance on the math indicator is 95.4, and the height of the gray bar where Howard is located is proportional to the number of schools that scored between 95 and 99.9.


Mouse over or tap a dot to view both the indicator score for a subgroup and the state percentile rank of that score within the subgroup. For example, the math indicator score for black students at Howard was 57.1; this puts Howard at the 68th percentile in the state for black student math performance among middle schools. The math score for white students at Howard was 100, and this was in the 85th percentile of statewide math performance for white students. (15% of schools had a score of 100 for white students, so all these schools are in the 85th percentile. In other words, they scored higher than 85% of schools in the state.)
Howard has a result in each subgroup category because they have at least 15 tested students in each category.
The mathematics CCRPI indicator, shown in the graph, can be thought of as a weighted proficiency measure. The indicator shows average student performance, where beginner achievement is worth 0, developing achievement is worth 50, proficient achievement is worth 100, and distinguished achievement is worth 150. The total indicator score is capped at 100, even though a high-performing school could score higher.
Use the filters on top to change to a different CCRPI indicator, highlight a different school, or add a comparison school. Mouse over or tap the blue info button to read a definition of the selected indicator. For more information about indicator definitions, see the calculation guides here.
The next visual shows the performance of elementary schools on the CCRPI progress indicator. Bolton is highlighted in red, and all other APS elementary schools are highlighted in blue. The graphs show that Bolton’s math progress score is 100 for each qualifying subgroup.
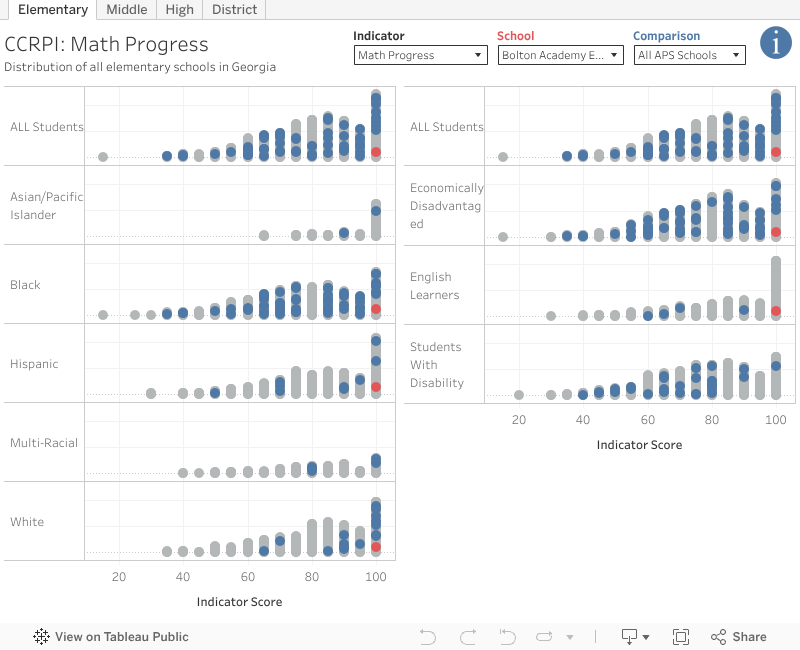

The math progress indicator is a weighted measure of Student Growth Percentiles based on year-over-year student progress on the Milestones exam.
The next visual shows the attendance indicator for APS high schools, with Atlanta Classical highlighted in blue. Atlanta Classical’s attendance score is in the 82nd percentile of the state at 85.8. This means 85.8% of students missed less than 10% of their enrolled school days.


The last visual shows CCRPI results at the district level instead of the school level. Atlanta Public Schools elementary math performance is shown in red, and Dekalb County is selected as a comparison in blue. Use the filters to switch grade levels or view other indicators or districts.

GADOE’s press release on the 2024 CCRPI results, including links to the state’s reporting tool, is available here. To get email alerts for similar posts, please subscribe to the blog.